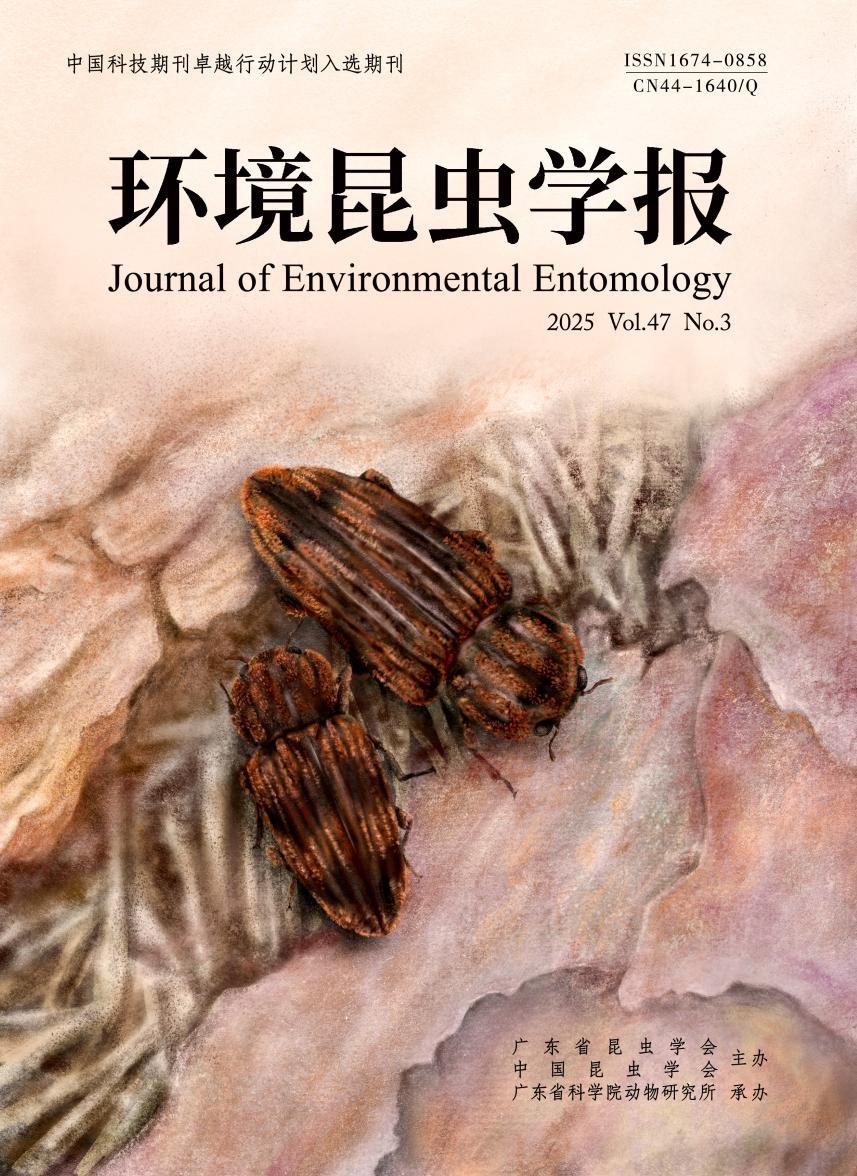
- 主办单位:中国昆虫学会、广东省昆虫学会
- 承办单位:广东省科学院动物研究所
- 主编:陆永跃
原刊《昆虫天敌》,由我国著名昆虫学家蒲蛰龙院士1979年创办,2008年正式更名为《环境昆虫学报》,双月刊,逢单月5号出版。邮发代码:46-18,每册定价98元。2024年入选中国科技期刊卓越行动计划中文期刊。
连续入选中国科学引文数据库(CSCD)、《中文核心期刊要目总览》和中国科技核心期刊。现被日本科学技术振兴机构数据库(JST)、《动物学记录》(ZR)和国际农业与生物科学中心(CABI)的CAB Abstracts数据库等国外数据库收录。
本期文章目录2025年
草地贪夜蛾绿色防控
- 岳 阳,蒋杰贤,张彤瑶,季香云,张 浩
 不同玉米品种对草地贪夜蛾生长发育和淡足侧沟茧蜂寄生的影响
2025 Vol.47(3):671-680 [摘要](57) [PDF 1099k](53)
- 骆清兰,张春晖,李平东,李志强,黄乐婷,叶智文,吴瑞璇,陈科伟
 个体间协作对叉角厉蝽捕食草地贪夜蛾幼虫能力的影响
2025 Vol.47(3):681-688 [摘要](57) [PDF 2934k](49)
- 张 栩,温瑞琦,王 广,陈 斌,彭跃进
 莱氏绿僵菌MDXZ200803和SLSY200714对草地贪夜蛾幼虫致病性差异的研究
2025 Vol.47(3):689-700 [摘要](51) [PDF 18360k](51)
- 徐鹏飞,龙秀珍,何 瞻,高旭渊,曾宪儒,韦德卫,熊 涛,于永浩
 莱氏绿僵菌CDTLJ1侵染草地贪夜蛾的显微观察
2025 Vol.47(3):701-711 [摘要](43) [PDF 5673k](43)
昆虫群落多样性与环境响应
- 韩金航,冯 康,杜喜翠
 秦巴山区、南岭地区和横断山区斑野螟亚科昆虫多元相似性研究
2025 Vol.47(3):712-720 [摘要](42) [PDF 30049k](49)
- 安依妍,李彦巧,党利红
 陕西秦巴山区缨翅目昆虫物种组成及区系分析研究
2025 Vol.47(3):721-730 [摘要](39) [PDF 22773k](47)
- 贾雨桥,王 霞,李玉春,巴依苏拉,鲍婉婷,李红霞,乔轶华,彭少刚,陆鹏飞,程业森
 内蒙古额济纳胡杨林昆虫群落结构及多样性分析
2025 Vol.47(3):731-745 [摘要](40) [PDF 1585k](39)
- 蒋 涵,王雪儿,邱 林,丁文兵,贺华良,高 俏,高宏帅,李有志,薛 进
 低镉水稻对田间节肢动物群落的影响
2025 Vol.47(3):746-754 [摘要](35) [PDF 1238k](41)
- 林亚杰,申亚钢,郭东旭,王 芮,陆怀进,万 霞
 刈割和农药喷洒对机场草坪昆虫群落的影响—以宁波栎社国际机场为例
2025 Vol.47(3):755-766 [摘要](34) [PDF 31303k](43)
- 吕 军,程 琴,李 超,康 奎
 南方水稻黑条矮缩病毒对白背飞虱内共生菌群落的影响
2025 Vol.47(3):767-775 [摘要](40) [PDF 30979k](45)
专论与综述
- 黄明度,欧阳革成
 柑橘-藿香蓟复合种植系统控害作用的研究与应用
2025 Vol.47(3):776-783 [摘要](42) [PDF 985k](42)
环境与昆虫
- 贺 娜,张知晓,户连荣,马惠芬,卢 兰,刘 凌,季 梅
 气候变化下新入侵种——西部喙缘蝽在中国的潜在分布区预测
2025 Vol.47(3):784-794 [摘要](44) [PDF 3411k](48)
- 施如康,许贞魏,贺炯坤,杨允菲,韩大勇,陈 晨,李东育
 基于优化MaxEnt模型的新疆黑蜂生境适宜性评价
2025 Vol.47(3):795-807 [摘要](37) [PDF 42667k](44)
- 黄 芳,孙双艳,付海滨,詹国平,潘绪斌,王 聪,李惠萍
 基于MaxEnt模型的暗色粉蚧全球潜在分布区预测
2025 Vol.47(3):808-816 [摘要](43) [PDF 811721k](63)
- 倪美虹,杨欣怡,钱明辉,蒋明星
 景观因素对红火蚁扩散的阻挡作用分析
2025 Vol.47(3):817-824 [摘要](38) [PDF 1126k](42)
- 杨旭兵,高海燕,董瑞文,韩海斌,张 玉,高书晶
 环境因素对亚洲小车蝗表型可塑性的影响
2025 Vol.47(3):825-833 [摘要](40) [PDF 1690k](39)
生理与生化
- 周家怡,柯云玲,叶 飞,李志强
 贵州钝颚白蚁(蜚蠊目:白蚁科:象白蚁亚科)线粒体基因组测序及分析
2025 Vol.47(3):834-846 [摘要](41) [PDF 3362k](39)
- 曹胜雁,刘 叶,田 迅,陈宇杰,马红悦
 基于比较转录组测序的亚洲玉米螟幼虫滞育相关基因筛选
2025 Vol.47(3):847-860 [摘要](39) [PDF 228146k](49)
- 王雪芹,蒋月丽,巩中军,王恒亮,武予清
 荻草谷网蚜对低温胁迫响应的转录组学分析
2025 Vol.47(3):861-869 [摘要](38) [PDF 1520k](40)
- 康泽泓,朱展鹏,蔺良杰,吴洪鑫,李 昂,陆永跃,金丰良,许小霞
 红火蚁SiMLs免疫响应不同病原物的表达模式分析
2025 Vol.47(3):870-882 [摘要](36) [PDF 921969k](55)
- 温雪梅,邵雪花,何翔宇,秦子昕,梁 赫,徐玉辉,路 伟
 双香豆素抑制SL-221细胞增殖的差异代谢物分析
2025 Vol.47(3):883-893 [摘要](27) [PDF 9427k](38)
害虫治理
- 林 臻,范小龙,邓孔洪,林键沁,匡东东,周志艳
 植保无人飞机作业参数、作业方式对防治井冈蜜柚园柑橘全爪螨效果的影响
2025 Vol.47(3):894-903 [摘要](32) [PDF 4971k](39)
- 侯文超,王爱东,胡 阳,李晓曼,王 琳
 美国白蛾性信息素国产诱芯及智能监测设备应用效果研究
2025 Vol.47(3):904-911 [摘要](33) [PDF 1572k](34)
- 杨天赐,鲍泽英,孔 丹,付柯锦,史春娟,陈明环
 基于Lucid的中国伊蚊属分亚属智能鉴定系统的开发
2025 Vol.47(3):912-922 [摘要](32) [PDF 3935k](43)
- 杨怡诗,任学明,张桂健,魏冰冰,牛长缨
 两种酵母菌发酵物对橘小实蝇的引诱作用
2025 Vol.47(3):923-932 [摘要](30) [PDF 1193k](34)
- 王容燕,焦文哲,高 波,李秀花,张 涛,陈书龙,马 娟
 暗黑鳃金龟成虫对梨树挥发物的行为选择
2025 Vol.47(3):933-940 [摘要](32) [PDF 1208k](38)
- 刘 鑫,刘 恋,刘 慧,龚碧涯,陈 浩,周凌磊,吴 广,杨锦鹏,马先锋,肖伏莲,邓子牛
 植物源喷雾助剂特性及其防治柑橘红蜘蛛评价
2025 Vol.47(3):941-947 [摘要](30) [PDF 2648k](35)
- 蒋月丽,李 彤,曹 琼,王振声,巩中军,苗 进,李好海,武予清,鲁传涛
 黄光照射对斜纹夜蛾成虫产卵和寿命的影响
2025 Vol.47(3):948-954 [摘要](31) [PDF 1116k](33)
资源昆虫
- 钟辉辉,李超群,冯寒松,文新根,黄金葵,刘兴平
 花绒寄甲的交配能力及多次交配对生殖产量的影响
2025 Vol.47(3):955-964 [摘要](28) [PDF 4320k](34)
- 孙淦琳,杨 韵,蔡浩升,余俊坤,于志钢,唐 垚,李政宾,肖关丽,陈 斌
 利用黄粉虫蛹扩繁黄带犀猎蝽的效果研究
2025 Vol.47(3):965-974 [摘要](27) [PDF 57405k](39)
- 倪 婧,李 波,李玲利,谢道燕,张永红,杨振国,白兴荣
 叉角厉蝽对家蚕幼虫的捕食作用
2025 Vol.47(3):975-983 [摘要](28) [PDF 31860k](35)
- 汪维华,郑丽旧,叶政培,符悦冠,张方平,陈俊谕
 不同温度下长刺新小绥螨对朱砂叶螨的捕食效能
2025 Vol.47(3):984-992 [摘要](29) [PDF 1540k](32)
- 黎 静,郑丽媛,左玉情,琴安得,申佳妮,廖怡姝,吕 洋,苏松坤,李志国
 5-羟甲基糠醛对意大利蜜蜂工蜂学习行为及头部学习相关基因表达的影响
2025 Vol.47(3):993-1000 [摘要](31) [PDF 1798k](37)
合作伙伴


